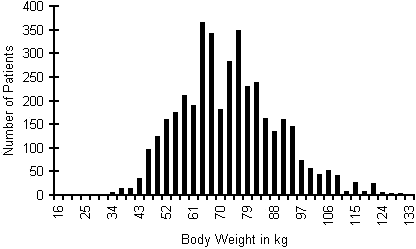
Body weight distribution of patients undergoing CT scan
 The population of this study was consecutive adult cancer patients having CT
scans of the chest and/or abdomen, during a 4 year period between 1996 to 1999. A
total of 3992 CT scans were prospectively collected and analysed. The body weight
distribution of this population is shown in the graph. The 2 peaks correspond to a mean
female body weight of 64 kg and a mean male body weight of 78 kg.
Body weight categories were established, as shown in the table below.
| Weight Category | < 38 kg | 38-47 kg | 48-63 kg | 64-77 kg | 78-97 kg | 98-117 kg | 118 + kg |
|---|---|---|---|---|---|---|---|
| Number of patients | 23 | 155 | 1015 | 1374 | 1115 | 262 | 48 |
| Percentage | 0.6% | 3.9% | 25.4% | 34.4% | 27.9% | 6.6% | 1.2% |
The central 3 weight categories contain 88% of the patients.
The mean weight in this patient population was 73.0 ± 16.7
kilograms.
The mean weights in each weight category are shown in the following table.
| Weight Category | < 38 kg | 38-47 kg | 48-63 kg | 64-77 kg | 78-97 kg | 98-117 kg | 118 + kg |
|---|---|---|---|---|---|---|---|
| Mean weight | 29.6 | 44.2 | 56.8 | 70.6 | 86.0 | 105.2 | 122.9 |
back to CT scan weight based protocol index
End of page Navigation links: Halls.md home or Back to top
Copyright © 1999 - present. Steven B. Halls, MD . 1-780-608-9141 . [email protected]